Methodology
Indicator selection
The index is built from indicators, observable, measurable variables that stand in for the underlying conditions of housing vulnerability...
The index is built from indicators, observable, measurable variables that stand in for the underlying conditions of housing vulnerability. Indicator selection followed an iterative, theory-driven process. Candidate indicators were first mapped against the index's conceptual framework — its four dimensions (Safe, Secure, Healthy, Sustainable) and two domains (households and dwellings) — before data availability was considered. This deliberate sequencing ensured that the indicator set reflected the index's theoretical structure rather than the constraints of available data. Each candidate indicator then had to satisfy four criteria at once:
- Theoretical justifiability: a clear, defensible link to housing vulnerability, grounded in the research literature.
- Spatial availability: data available at, or able to be aggregated to, the small-area (SA2) level, with coverage across all states and territories.
- National consistency: collected the same way across jurisdictions, so that values are genuinely comparable between areas in different states.
- Policy interpretability: meaningful to policy and community audiences, rather than relying on technical constructs that are hard to communicate.
Indicators with a strong conceptual case but no suitable data were documented, making the gaps in Australia's housing data explicit. Because household socioeconomic data (largely from the Census) is more consistently available at small-area scales than physical dwelling data, the final set contains more household than dwelling indicators, reflecting the available data.
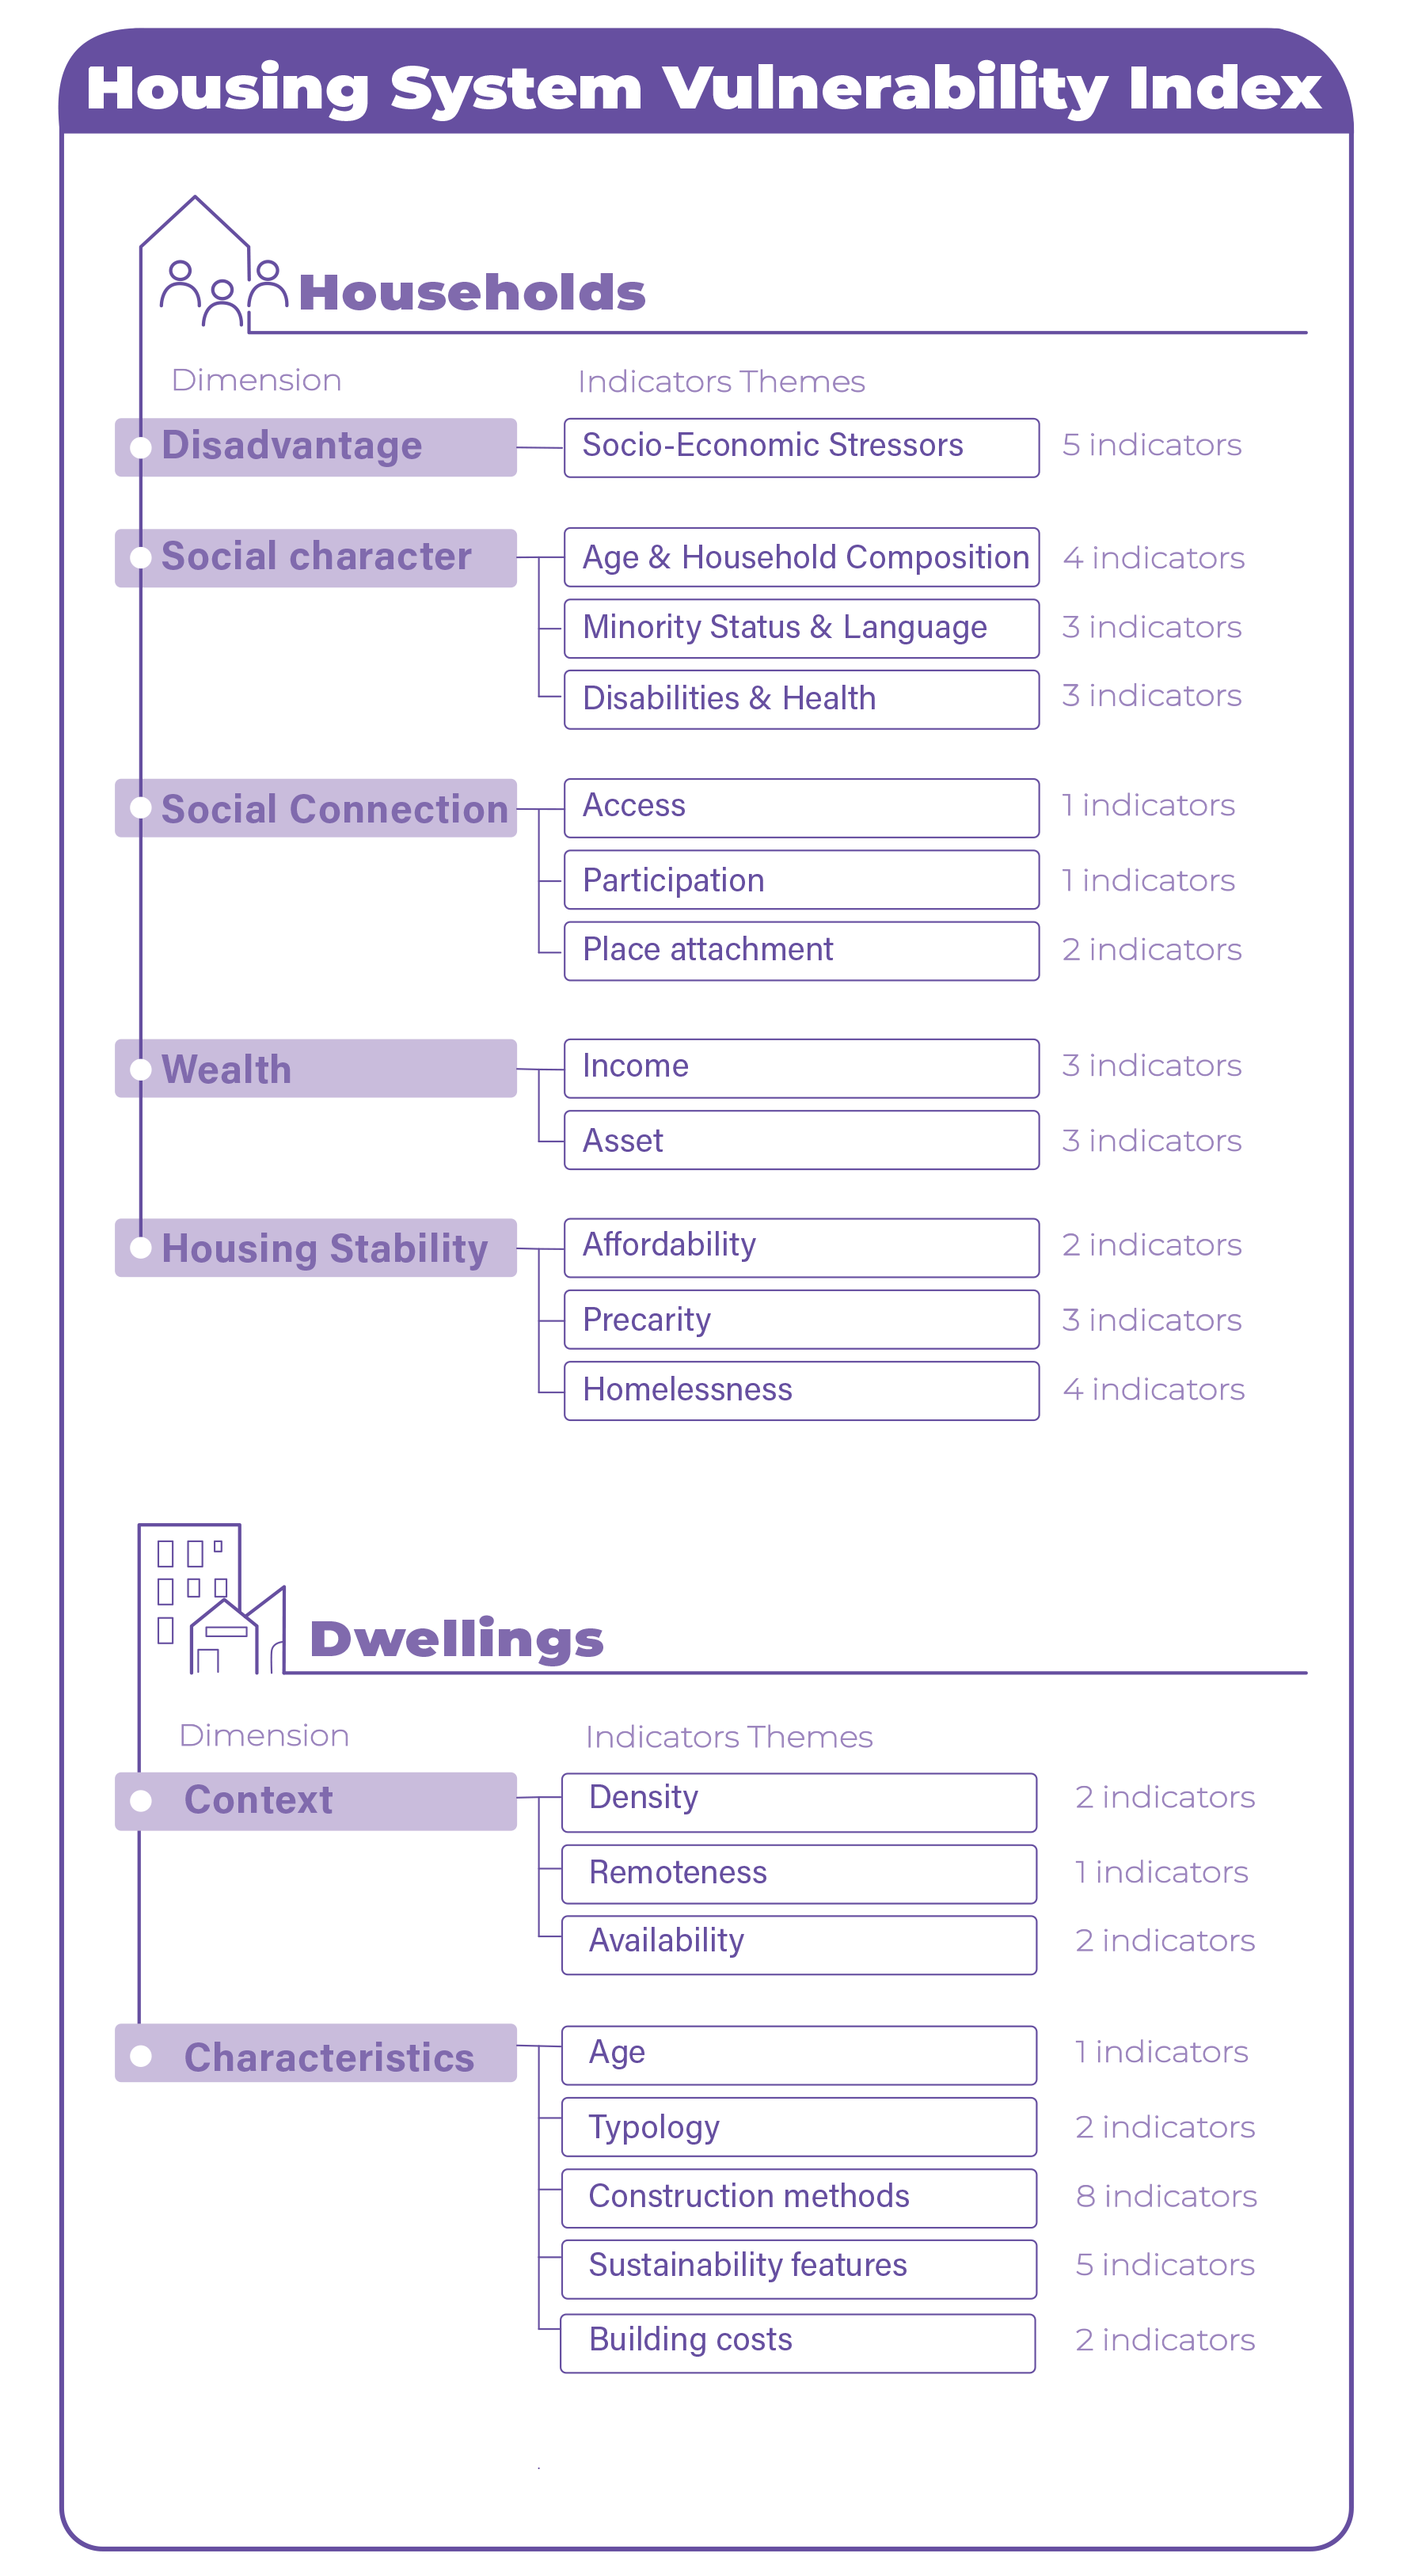
The indicators were organised across the two domains: household circumstances (such as income, tenure, financial stress, health and demographic characteristics) and dwelling and contextual characteristics (such as dwelling age, type, construction and energy performance), which are treated as distinct components and produce separate sub-indices. Each indicator was also assigned a direction before any calculation, recording whether higher values point to greater or lesser vulnerability.
Data integration and index construction
Once the indicators were selected, they were prepared and combined through a consistent, transparent process...
Once the indicators were selected, they were prepared and combined through a consistent, transparent process. Because the indicators are expressed in different units (i.e. percentages, counts, dollar values), each was rescaled to a common scale so they could be combined on comparable terms.
The index applies equal weighting: indicators, domains and dimensions each contribute on equal terms. Because the index is built deductively, its indicators are drawn from a conceptual framework; each dimension is treated as theoretically necessary, and none is assumed to matter more than the others. Equal weighting avoids imposing an unfounded judgement about relative importance, keeps the conceptual structure of the index intact, and produces transparent, interpretable scores that are straightforward to communicate to policy and community audiences. This is consistent with established practice for conceptually driven composite indices.
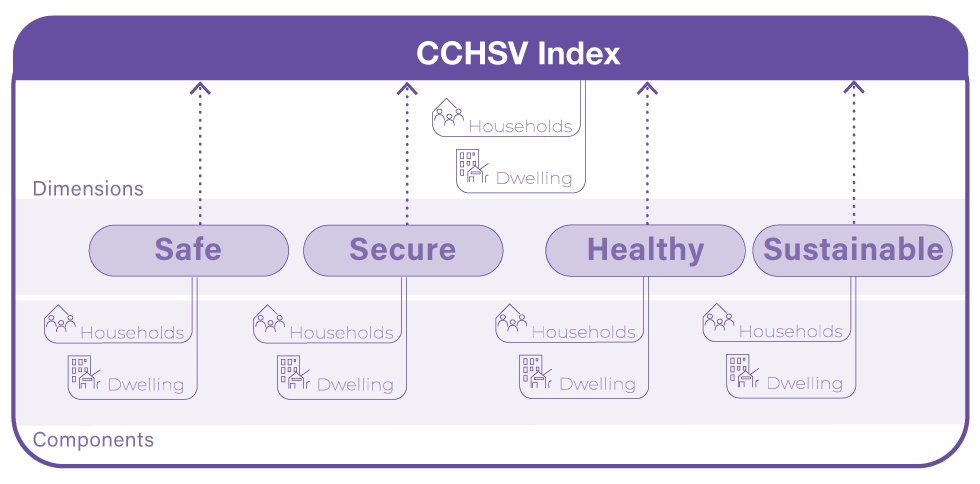
The index is assembled from the bottom up. Its structure combines the four dimensions (Safe, Secure, Healthy and Sustainable) with two domains: a household domain, capturing the circumstances of the people living in a dwelling, and a dwelling domain, capturing the physical characteristics of the housing stock. Crossing the four dimensions with the two domains produces eight building-block sub-indices, one for each dimension in both the household and dwelling forms. These are aggregated upward in stages: the two domains combine within each dimension to give four dimension scores; the sub-indices also combine across dimensions to give overall household and dwelling scores; and these feed into a single overall index score for each area. Scores are normalised at every step, so each level of the index sits on a common scale.
Structure of the CCHSV Index
The index is assembled from the bottom up. At the base, each of the four dimensions is measured through two components: household and dwellings. These components combine to form each dimension, and the four dimensions combine into the overall CCHSV Index.
Data sources
The CCHSV Index draws on eight primary datasets, chosen to be publicly available where possible, nationally consistent, recent, and available at — or able to be aggregated to — the small-area (SA2) scale...
The CCHSV Index draws on eight primary datasets, chosen to be publicly available where possible, nationally consistent, recent, and available at — or able to be aggregated to — the small-area (SA2) scale. They fall into three groups by access type: open government data, restricted administrative data, and commercial data.
The backbone of the index is the Australian Bureau of Statistics (ABS) 2021 Census of Population and Housing, which supplies the majority of household indicators directly at the SA2 level and informs all four dimensions. Census variables cover income, employment, education, household composition, housing tenure, housing cost stress and overcrowding, and because the Census is collected uniformly across the country it provides comprehensive national coverage at a consistent geographic scale.
Two further administrative sources add detail on the household side: individual tax return data from the Australian Taxation Office, and the PHIDU Social Health Atlas (Torrens University Australia), from which a measure of private health insurance coverage is used as a proxy for financial resilience.
The physical housing stock is captured chiefly through Geoscience Australia's NEXIS Building Exposure Database, which provides dwelling characteristics such as age, type, construction and floor area. This is complemented by dwelling energy-performance ratings from the NatHERS scheme (provided by CSIRO); residential property and market data from Cotality (formerly CoreLogic); and two measures of household energy resilience: rooftop solar uptake from the Australian PV Institute, and small-scale renewable installations recorded by the Clean Energy Regulator through Small-scale Technology Certificates.
The index is built at the SA2 level. Because these sources are released at a range of native scales such as SA1, SA3, suburb, postcode and Local Government Area data reported at other scales were allocated to SA2 using standard concordance methods.
Data limitations
The index is designed to be transparent and robust, but several limitations should be kept in mind when interpreting it...
The index is designed to be transparent and robust, but several limitations should be kept in mind when interpreting it.
First, its core socio-economic data comes from the 2021 Census, which was conducted during COVID-19 lockdowns across much of south-eastern Australia. The ABS assessed the data as fit for purpose, but the period was atypical with unusually high property prices, very low rental vacancies, disrupted migration patterns, and temporary income support that reduced measured housing stress. Indicators sensitive to income and market conditions should be read with this in mind. More broadly, the index is a single snapshot assembled from sources with different reference years, so it reflects conditions at the time the data were collected rather than the present or any future development.
Second, nationally consistent data is far richer for households than for dwellings. The index draws on more household indicators than dwelling ones, and several dwelling measures rely on proxies for example, dwelling age standing in for compliance with modern construction standards rather than detailed building-level information. This makes the dwelling side of the index thinner and more dependent on individual sources.
Third, only about half of the indicators were originally available at the small-area (SA2) scale; the rest were allocated from larger areas such as postcodes and local government areas. This allocation can introduce error where boundaries do not align, and a number of rural and remote areas could not be matched at all, leaving gaps in those regions.
Fourth, because the index describes areas and not individual households, a single SA2 score can mask real differences between neighbourhoods and the households within them. The index shows where vulnerability is concentrated at a broad geographic level; it does not describe the circumstances of any particular household.
Together, these limitations mean the index is best used as a screening and prioritisation tool, read alongside local knowledge and current hazard information, and not interpreted as a definitive measure of risk for any specific place or household.